Network monitoring

See the network behind your critical services.

A live port-level map, SNMP monitoring and routing change triggers from the switches you already own, with no agents or inline appliances.

When a device fails, Rebasoft shows which business services it belongs to.

NETWORK MAP LAN_PORT2 → ge-0/0/5.0 ge-0/0/6 → Gi1/0/28 ge-0/0/10.0 → ge-0/0/1.10 DrayTek DRAYTEK DRAYTEK CORPORATION 1 srx320 SRX320 JUNIPER NETWORKS, INC 1 rebac2960s.rebasoft.net REBAC2960S CISCO SYSTEMS, INC 4 ex2200-poe EX2200-POE JUNIPER NETWORKS, INC 5
In the console

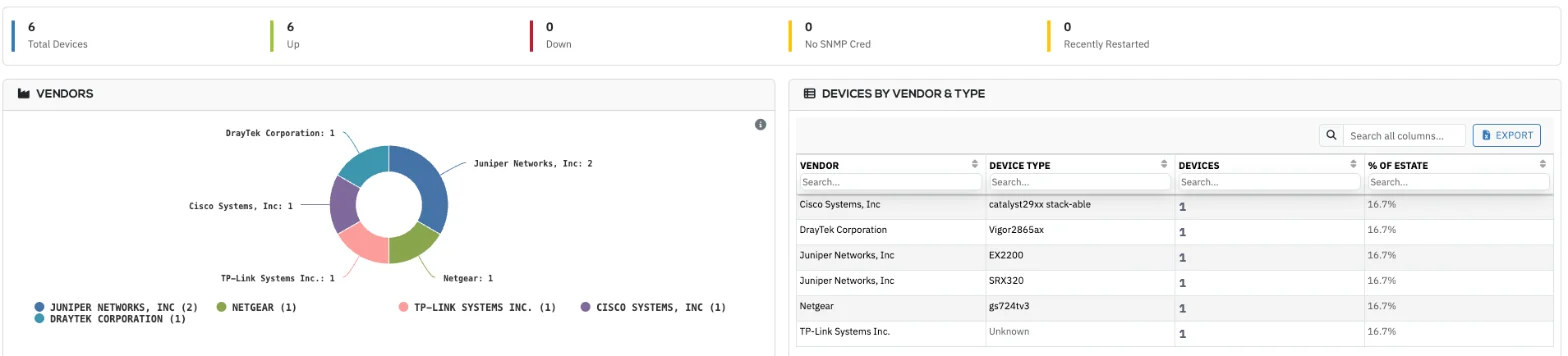
Your network at a glance

Device status, vendors and models, collected from the network itself.

From a Rebasoft demo estate.
Map and monitor

The network map maintains itself as the network changes

Hand-drawn diagrams go out of date as soon as they are finished. Rebasoft builds its map from the network itself, which ends the upkeep and puts device health and routing events on the same screen.

Live topology

LLDP, CDP, ARP and switch tables build the map, showing which device sits on which switch port and VLAN.

SNMP health

29 monitoring templates, including IP SLA, cover health, utilisation and errors on your network devices.

Routing change triggers

Traps, BGP, OSPF and route changes appear as events in the console and drive policy, so your team sees a routing change as it is logged.

An unexpected device

Know about an unknown device within minutes

  1. 14:02

    An unexpected device connects

    It appears on the map with its switch, port and VLAN.

  2. 14:03

    The team is told

    A device policy responds to the new MAC address and sends the alert by email or to Slack, so nobody has to spot it.

  3. 14:04

    The engineer checks what is known

    The device has no owner and no inventory, and it sits at the bottom of the discovery ladder.

  4. 14:40

    The owner is identified

    The device proves to be a new door controller from the facilities team, so it gets an owner and joins the asset list.

A composite of real customer situations. Times are illustrative.

A UK boarding school

One school replaced two separate network tools with Rebasoft, with no agents to install.

“We were able to become more effective with fewer systems to operate and use.” Network manager, UK boarding school
Policy engine

Automate the response, so your team doesn’t have to chase it

Around 70 triggers

Policies respond to events such as a new MAC address, a state change or a new DHCP lease, instead of waiting for someone to notice.

Act across the network

Scripted policies can shut a switch port, move a device to another VLAN, or act through SSH, PowerShell, SNMP and HTTP.

Keep people informed

Notify your team by email or syslog, or post to the channels it already works in, such as Slack.

Consolidation

Retire the diagrams nobody updates

Hand-maintained network diagrams
Can replace
The map is built from the network itself.
Standalone flow analysers
Can replace
Network traffic analysis is part of the platform, tied to the asset at each end.
Network device monitoring
Can replace
SNMP health, utilisation and errors for switches and routers sit next to the map and your traffic data.
Common questions
Do we need agents?
No. Rebasoft works with your switches and routers, so there is nothing to install on endpoints or maintain.
Do we have to re-engineer the network?
No. Nothing sits inline, and Rebasoft uses the switches you already own, so there is no redesign and no new point of failure.
What does Rebasoft monitor?
Health, utilisation and errors on your switches and routers over SNMP, with traps and routing changes shown as events in the console.

More questions? See the full Rebasoft FAQ — answers by topic and by role, or how Rebasoft is priced.

See the network behind your services

In thirty minutes on a live console, you will see the map, the health view and how policies respond to change.