
Which systems does your service really talk to?
See where your traffic goes
Traffic by asset type, domain and country, from the flow data your network already produces.
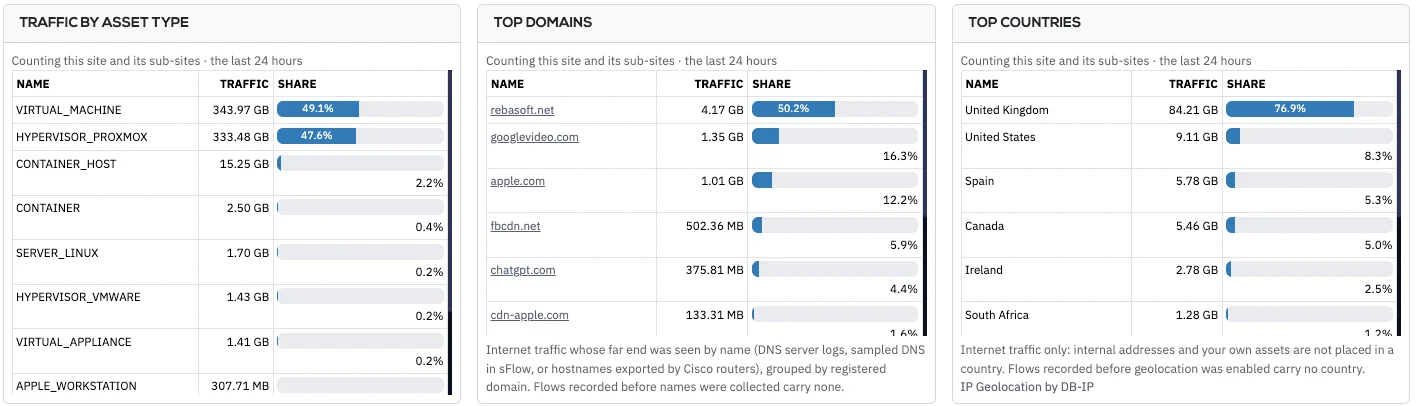
Conversations are stitched once and tied to named assets
A flow tool leaves your team to work out what each address is. Rebasoft pairs both halves of a conversation, works out which end opened it, counts it once, including through NAT, and names the asset, site, user and SaaS service involved. Investigations start with answers.
The telemetry you already export
NetFlow, IPFIX and sFlow appear in the same screens as AWS and Azure flow logs, with no probes to buy or deploy.
A clear view of link use
Top talkers, applications, sites, subnets, countries and domains are ranked by current rate rather than lifetime counters.
Storage that looks after itself
Raw flow takes a set share of disk, with a 30-day default ceiling, and summaries are kept for up to 10 years, all on your own infrastructure.
Workstation-to-workstation traffic stands out
Judged by address and port alone, lateral movement hides in the noise. Rebasoft assesses internal traffic by role pair: servers routinely replicate, whereas workstations have little reason to address each other.
- 14:02
One workstation contacts another
It opens connections on a port the target does not normally serve.
- 14:02
A single finding is raised
Rebasoft knows which end opened the conversation and what both ends are, so it raises one finding. A printer answering a print job raises none.
- 14:10
The engineer reviews the flows
She opens Threat Activity and plays back the recorded flows behind the finding.
- 14:20
The finding is resolved
If the activity is benign, she marks it as expected. A new port would raise a new finding.
A composite of real customer situations. Times are illustrative.
Bandwidth incidents open on saturation rather than noise
Rebasoft separates real pressure on a link from harmless spikes, so engineers respond to what matters.
Sustained
When a link holds 80% across three windows, an incident opens that names the device and interface.
Burst
An incident opens when traffic jumps far above its baseline and takes at least half the link, so a rise from 300 kbps to 3 Mbps passes without one. Each interface and direction has one burst at a time, followed by a burst-ended event, and top talkers show what is behind it.
Stored flows answer new questions
Flow data usually ages out before anyone needs it. Rebasoft keeps the evidence behind its findings, and scans, floods, backscatter, brute force and lateral movement become findings your team works through to a close.
Retro-hunt
When an address joins the threat list, Rebasoft searches stored flow, so contact from last week surfaces without a manual hunt.
Flight recorder
The raw flows behind a security finding are copied when it opens and held for 90 days, well beyond ordinary raw retention. They are opened from the finding.
Forensic explorer
Engineers drill from a summary to the underlying records, or view flows live.
Flow data is tied to people, workloads and services
SaaS use by person
Flow, proxy users and directory accounts together show who uses which service.
Pods without an agent
Exported flow carries pod addresses, and Rebasoft resolves them at the time of the flow, so names remain correct after the pod has gone.
Automatic service profile card
Engineers inspect what a host serves and to whom from a card built from flow, with no rules to write or maintain.
Retire the standalone flow analyser
From the blog

7 Best SaaS Discovery Tools for Clearer Control
Compare the best SaaS discovery tools for continuous visibility, risk prioritisation and audit-ready evidence across your organisation’s cloud estate.
Read article
How to Classify Critical Assets by Business Impact
Learn how to classify critical assets using service context, dependency mapping and evidence to reduce cyber risk, improve resilience and focus action.
Read article
CMDB Versus Asset Discovery: What You Need
CMDB versus asset discovery: understand what each delivers, where records fail, and how visibility strengthens risk, resilience and audit evidence daily.
Read articleWhich formats does it take?
Will this replace our flow analyser?
What does setup involve?
More questions? See the full Rebasoft FAQ — answers by topic and by role, or how Rebasoft is priced.
See your flow data tied to your assets
In thirty minutes on a live console, you will see stitched conversations, role-pair findings and the flows behind them.